infographic

Informed Infographics: Using Theory to Support Visual Presentations

“Hurricane Sandy: The Financial Aftermath” infographic presents financial data, statistics, and a personal account in one space, and it examines the financial plight of storm victims in light of the financial assistance they have received through FEMA and insurance policies, compared to the financial loss suffered.

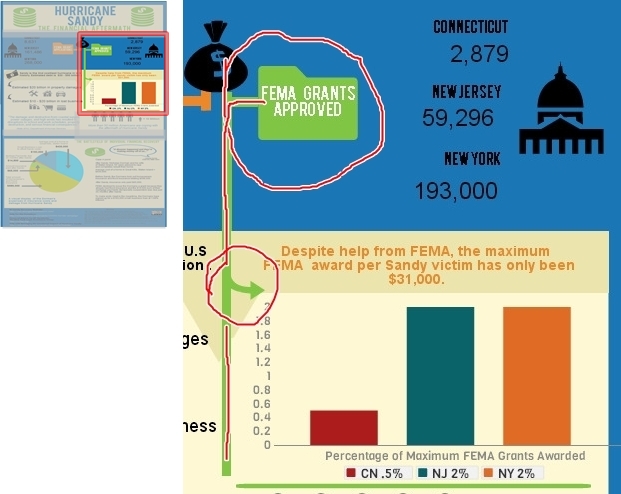
To set up a comparative framework, (as seen in the screenshot below) I contrasted the number of FEMA grant applications sent in from Connecticut, New Jersey, and New York, with the number of FEMA grants that were actually approved for those states respectively. For example, in the upper third of my infographic, I used icons to help convey different kinds of information:  the folder icon for bureaucratic process, the money bag icon for funds, and an icon that resembles our capitol building to represent state government.  Edward Tufte, (2006) contemporary author and expert on the visual display of qualitative and quantitative information, writes in Beautiful Evidence, to place labels directly on images when possible–which in turn helps to reinforce and concretize connections and causal relationships. “For showing evidence, the map metaphor suggests that labels belong on images, that external grids help scale images, and that data are more credible when contextualized” (p. 21). Likewise, I have placed the labels for “FEMA Grant Applications” and “FEMA Grants Approved” directly onto the orange and green folder icons. The names of the states and the numerical data are placed in very close proximity so that they appear as sets of information, easily distinguishable from one another.

Hurricane Sandy: The Financial Aftermath

Tufte instructs, “For explanatory presentations, important comparisons among images should usually be pointed out to viewers by means of annotations, arrows, highlighting, or other methods of directing attention” (p. 45). Therefore, to concretize connections on the page-space, I use different styles of arrows. For example, in the mid-section, the green arrow that flows off of the green line functions to connect the upper portion featuring the data about “FEMA Grants Approved” to the graph which states the exact dollar amount of the Maximum FEMA Grant ($31,000) and the percentage of people in Connecticut, New Jersey, and New York who received the Maximum FEMA Grant Award.

Hurricane Sandy: The Financial Aftermath

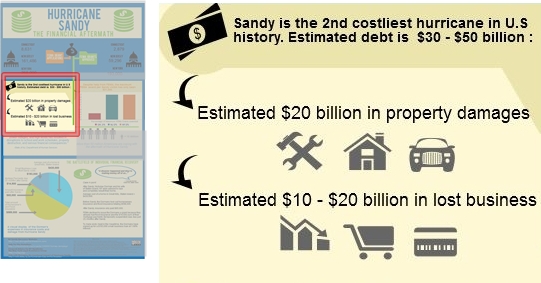
Moving over to the left-hand side of the mid-section, (see screenshot below) I use curved black arrows to connect the first statistic about Hurricane Sandy being the 2nd costliest hurricane in U.S. history to more specific financial data. First, I state that the estimated debt from the storm as being $30 – $50 billion and then just below that statistic I provide a breakdown, ($20 billion in property damages and an estimated $10 – $20 billion in lost business). The arrows are black because the icons are gray; so having a difference in color between the elements helps to break up the visual field and differentiates the arrows from the images.  Here, the arrows not only serve to visually connect the information, but they also create a sense of hierarchy by functioning as bullet points.

Hurricane Sandy: The Financial Aftermath

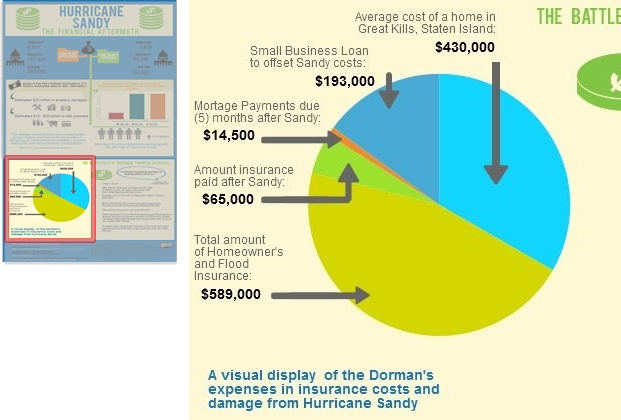
Now, when creating the pie chart to represent the financial aftermath of the storm on an individual level, I had the option to simply connect the financial data to the chart using thin lines in a minimalist style. However, Tufte would argue that, “The more generic the arrows and lines, the greater the ambiguity” (p. 68). So, in line with his ideas, I decided to create customized arrows to help ground the text and numbers to the exact place on the pie chart. Doing so helps to avoid confusion and assists the reader in being able to quickly scan the infographic and see what information is being communicated without having to closely study and dissect the graphic.

Hurricane Sandy: The Financial Aftermath

Ellen Lupton, (2010) author of Thinking With Type, writes, “A typographic hierarchy expresses the organization of content, emphasizing some elements and subordinating others” (p. 132). To create a sense of hierarchy for the bottom third of the infographic, I used the same font for the header, “The Battlefield of Individual Financial Recovery” that I used for the main title, “Hurricane Sandy, The Financial Aftermath”. I made this design choice in order to convey that the information presented is not a continuation of the mid-section, but instead a new set of information. Additionally, I added visual distinction by shading it in green. Just below the header, outlined in a blue speech bubble, is a direct quote from Nicholas Dorman, a Great Kills, Staten Island resident, which serves as a caption: “A disaster happened and they’re making money off of us.” I wanted to use a direct quote from a real person to allow the statistics and financial information a more human feel, which in turn helps the reader to better identify with the case presented.

Some readers are “primarily attracted to pictures and captions, while others prefer to follow a dominant written narrative…” (Lupton, 2010, p. 130). The caption assists in framing the range of financial facts and data in a more local scope and personal context, and it also lets the reader know at a glance specifically what the text is going to discuss. Regarding typographic design choices for pie chart label, I selected a vivid blue in a Helvetica typeface at a size 14 font, bold. These attributes allow the chart label to be easily read while appearing visually soft at the same time, so as not to be appear too heavy or overpowering.  As Lupton writes, “Scale is the size of the design elements in comparison to other elements in a layout as well as to the physical context of the work” (p. 42).

Hurricane Sandy: The Financial Aftermath

Sources

Lupton, E. (2010). Thinking with Type. New York: Princeton Architectural Press.

Tufte, E. (2006). Beautiful Evidence (3rd Edition). Cheshire: Graphics Press LLC.

Categories: infographic, information architecture, technology, tufte | Tags: , , , , , , , , , | Leave a comment

Hurricane Sandy, The Financial Aftermath: An Infographic

I have been researching Hurricane Sandy since it occurred in October of 2012 and have since created a multimodal project that presents the emotional and material aftermath of experience. However, in recent months (currently about 8 months after Sandy), storm victims are still facing extremely difficult financial realities—for many people trying to navigate the gauntlet of insurance policies and FEMA procedures has proven to be an overwhelming task, to such an extent that it has required bringing in legal help from out-of-state skilled in dealing with flood disasters. For example, many storm victims are grappling with the reality that, (unbeknownst to them) if they had insurance prior to the storm, they may be ineligible to receive money from FEMA—or very little at that. And in other cases, insurance companies are denying payment until borrowers can show proof of how the money will be spent. Recovering from the devastation of losing your home, your vehicle, nearly all of your material possessions is hard enough, let alone be denied compensation after having paid thousands in flood and homeowner’s insurance. After hearing about people having to take out loans well into the six-figure range just to float costs while trying to recover, I wanted to bring attention to the crushing circumstances Hurricane Sandy victims are still facing. My infographic highlights the hard-hitting financial reality of the storm on both a broad scale and an individual level.

My infographic, "Hurricane Sandy: The Financial Aftermath" using Piktochart technology

My infographic, “Hurricane Sandy: The Financial Aftermath” using Piktochart technology

For example, in the upper third of my infographic, to represent FEMA and grant money (grant applications and grants approved) I used an icon which resembles a government building. I placed this icon on the left and right sides. Additionally, through the affordance of color and the use of shapes to highlight and connect information, I selected green for “FEMA Grants Approved” and used green lines to further connect the folder icon in the upper third, (“Grants Approved”) to the statistics and chart in middle third, (right side) where I used a chart to highlight facts about the maximum amount of FEMA awards and the percentage of maximum ($31,000) award for New Jersey, New York, and Connecticut. Doing so assists the reader in understanding a more specific reality pertaining to storm victims trying to get help from the government after the devastation–even though thousands did receive help, the amount of help the received is like a drop in the bucket compared to the funds that are actually needed to make a difference.

In conclusion, upon analyzing my process, I was somewhat pleased with the infographic results overall, in light of the fact that this was my first time using Piktochart. However, in retrospect, I think I would have liked to have more expertise in creating charts and visual displays of data. Specifically, I would like to have been able to present the reader with a type of chart that focuses on a comparative relationship. For example, I was able to plug in the figures for the Dorman’s financial facts, (e.g., average cost of home in Great Kills, amount of their small business loan to offset debt and setbacks from the storm, the amount their insurance paid versus the amount their insurance was supposed to cover, etc.,) but I would have liked to somehow compare the funds received as relative to what they were covered for, and the average price of a house in Great Kills, (as their home was destroyed in the storm). Being able to have more control over the visual representations of data in this way would better assist me in portraying the devastating amount of financial loss that many people are currently dealing with. However, I look forward to using Piktochart more in the future and employing this mode of representation which allows my reader to make visual connections with ease and quickly understand complex information.

Categories: infographic, information architecture | Tags: , , , , , , , , , | Leave a comment

Infographic blog 2

Rather than strictly throw numbers in the reader’s face, I wanted to create visuals to demonstrate the information I wanted to convey because Edward Tufte writes, “The similar treatment of text, diagrams, and images suggests to readers that images are as relevant and credible as words and diagrams (109).”. So, for my demographics panel, I made a cluster of white students juxtaposed with a smaller number of minority students to represent the disparity in racial representation of home-schooled students. Rather than write out a sentence or chart, I used stick figure graphics to show the difference to make a point about privilege and home-schooling because Tufte writes that we should use the object itself in our evidence presentations, rather than just their names (Tufte 121).

Originally, along with my projection screen backgrounds for two of my slides, I also had boxes to contain my snippets of data. After consulting Beautiful Evidence, I realized what a horrible mistake this was. So, I removed the boxes and the occasional cartoony arrow because “Omitting boxes increases explanatory resolution (Tufte 79).” Rather than clutter the design of the infographic with unnecessary frames, I focused on my message because “If every name is highlighted, no name is (79).”

To add a bit of “pop” to my header, I included an enlarged capital (versal) in “home-schooling (Lupton 125).” The house forms the x-height of the the “h,” and the chimney forms the ascender. Writing the header in this way also uses Tufte’s “using the thing to demonstrate the thing” principle. I used a few different fonts to try to convey the sense of a learning environment: The background of my infographic is green, and it’s filled with opaque equations scrawled all over, like a chalkboard. The header is a typeface called “eraser,” and it looks like magic marker written on a whiteboard or chalk on a blackboard. The body of the text uses the “JennaSue” typeface, which resembles the handwritten cursive a student might use to jot down his or her notes in class. Plus, the JennaSue typeface is in white, so it creates a suitable visual metaphor of chalk on a chalkboard. Finally, there’s a bit-like computer font used on a projection screen about certification for home-schooling parents.

Categories: diagrams, home-school, images, infographic, tufte | Tags: | Leave a comment

Infographic blog 1

I sat at a red light one day on my way home from work. I noticed the bumper sticker on the car in front of me, which said, “Proud parent of a homeschooled student,” or something to that effect. I wondered what it must be like to homeschooled, for your parents to be your teachers. Did homeschooled students have better test scores than public school students? Are they socially inept bookworms, or are they just as sociable as any traditionally schooled student? What makes parents want to teach their children themselves? Dissatisfaction with public education? Out of curiosity, I decided to make homeschooling the topic of my infographic.

The results were eye-opening. Home-schooled students are more likely to graduate college than public or private schools students, and they transfer more than twice as many AP credits going into their freshman year of college than public and private school students. With my infographic, I wanted to not only create awareness for this small subset of the student population in the United States, but also to show that they are performing better than traditionally schooled students across the board (which I’m sure not many people realize). My second panel supports my point, showing that the number of home-schooled students in America doubled in just four years from 2003 to 2007. The shift is gaining traction since parents can see the benefits to their children. And, interestingly enough, even though home-schooled students generally perform better on standardized tests and in college than public and private school students, they are, in fact, just as, if not more so, involved in the community.

I would have liked to have made graphics that showed a greater amount of contrast between home-schooled students and traditionally schooled students. Also, I would have liked to emphasize the community involvement panel a bit more, but the icons and images in Piktochart are limited. How can one show that home-schooled students go on field trips just like other students, or that home-schoolers are more likely to volunteer than traditionally schooled students? Overall, I feel I made a visually appropriate and eye-pleasing infographic that gives a solid overview of the many facets of home-schooling and home-schooling culture.

Categories: evidence, home-school, images, infographic, students | Leave a comment

Final Infographic and Reflections

InfographicFinal


Reflection 1

The goal of my infographic was to raise awareness about animal mills while also trying to convince people to adopt. I think people still see pet adoption as a less-than-ideal way to get a pet, because pets that are up for adoption are “second-hand.” I wanted people to see how adopting pets can help decrease the abuse animal mills perpetuate, and I wanted people to see that adopting does not mean you will be getting a “bad” animal. I think my use of icons and bright colors helps people clearly see my point. I wanted to use simplistic design to make my message the main focus, rather than complex design. The flow of my infographic shows how popular different pets are in the US, followed by statistics on animal mills. This may seem like an odd comparison, but I want it to point to the fact that many people who own animals unknowingly get them from animal mills. By following this up with details about animal shelters I wanted to show that they are a better alternative to pet stores and direct animal mill purchasing, because many animals die in shelters regardless of their good temperament and clean bill of health. In the end I reaffirm that there are multiple species of animals available for adoption, and I conclude with ADOPT written in large, bright pink lettering. I think I make it clear that adoption is a much better alternative to pet-store purchasing. I wanted to include more information about the pros of adopting, but with limited space and time I found it difficult. Piktochart is also not very user-friendly, so I found it hard to rearrange things, which I would have had to do if I were to add more information. I had a hard time trying to place objects without them jumping around from block to block, and I did not like that I couldn’t have images and text spread between two different blocks. I think it made creating the infographic more linear rather than free form. Surprisingly, I think I actually needed more physical room for my infographic. I would like to add a space that tells more about the availability of animals in shelters, including statistics about the health and breeding and species types of animals. I tried to cram some of that information in at the bottom of the infographic, but I think it would have been better if it were written out.

Reflection 2

I attempted to base my design largely on Tufte’s ideas. At first, I think I got caught up with Tufte’s “chart junk,” because I wanted to show my statistics with actual graphs. I was wrapped up in the preset layout which included charts–at first it seemed “prettier” and easier to understand. When I asked about it and reconsidered the best way to represent my stats, I came to realize it is much more effective and visually appealing to use icons as a visual representation of statistics. In my section about euthanasia in animal shelters, I chose to use cat and dog icons coupled with needles to represent the percentages of animals euthanized. This way, the graphic would not be filled with actual graphs, but visuals that showed the same information. I accompanied these visuals with a small amount of text, the minimal amount of text necessary to get the information across. My goal was to keep it clutter-free and straight forward. I also tried to group the information together, so that everything related could be seen in the same area, rather than forcing viewers to look all over and lose their trains of thought. Tufte believes both of these design choices are important to get information to viewers in the most effective way. Throughout my design I tried to make sure my visual enhanced and informed the alphabetic text, including the pink, red, green, and blue banners on the top section of my infographic. The statistics on animal ownership are accompanied by banners that visually represent the amount of animals owned in millions–meaning the largest banner is both first, and represents cats, which are the most owned in the US. I wanted all of my information to be backed up by visuals throughout, even in subtle ways. I included some arrows to help lead viewers’ eyes to related information as well, which Tufte uses in his own writing. For example, in my section about mill animals, I use an arrow to symbolize smoke coming from the factory. The arrow grows out of the top of the factory and leads the eyes to an explanation of animal mills. I wanted to arrow to serve two purposes. I also chose to use colors that were bright and eye catching. I did this for two reasons–first, because I wanted my infographic to grab the attention of virtual passersby, and second, because I wanted the bright colors to contrast with the information. Of course, bright colors are associated with exciting and happy things, but the information I am presenting is largely not. The contrast should be a bit shocking. Interestingly, the end message that convinces people to adopt does promote happiness and positive endings like the bright colors suggest.


Deciding which typeface to use for my infographic was tough. Like the color choice, I wanted the typeface to be inoffensive and calm. Fortunately, the default theme type included a sans serif header typeface that was long and smooth. I picked this because it was easy to read and didn’t really evoke much feeling. I especially liked it for the bottom “ADOPT” section because the typeface is very clean, no nonsense, and makes the message all the more straight-forward. For the main body text I chose a serif typeface that was equally clean, but a little more fun. I think the rounded, thick bowls seem remniscent of Comic Sans (yikes), but in a more sophisticated way. Again, I wanted the main body to be unobtrusive, contrasting the real message. The most important typefaces choice, to me, is my use of Courier New for my “hard hitting” statistics and facts. I chose Courier New because it is well known. CN is also associated with typewriter-like typefaces. I think using CN worked because typewriters are commonly associated with data, and much of the information I presented in this typeface was data driven. I also wanted it to stand out from the other more simplistic types. Unlike the other two, CN is thin and has tight leading. It stands out and because it is recognizable, it catches your eye.


Overall, I tried to make conscious decisions to follow the principles laid out by Lupton and Tufte. I think, for the most part, the choices I made based on their design ideas has enhanced the way I presented the information in my infographic.

Categories: infographic | Tags: , , , , , , , , , , , | Leave a comment

My infographic reflections

info2

Reflection 1

As a huge baseball fan, I wanted to find an aspect of the sport I could make an interesting presentation on (instead of Hey, so-and-so can still throw X amount of curve balls after X amount of years). In researching baseball-not uninfluenced by the amount of “42” trailers-I decided to investigate diversity in baseball. This was further revised to African-Americans and their presence in baseball. I’ve had arguments about this before, and many people simply say something along the lines of “It doesn’t matter what color a person is, baseball is just about how good you are as a player.” While this is true, I wanted to be able to illustrate that there are roadblocks keeping African-Americans from developing into major-league talent.

One of the problems I encountered with my first draft was a lack of any sense of narrative. I was all over the place. In this draft, I was able to focus on one group, which really helped me show change over time and offer reasons for the change. Since my topic is essentially disparity, I wanted visual reminders. To this end, I used graphs and color options to emphasize the differences. I also made use of the icons/images offered by Piktochart when talking about the reasons offered/suggested for why the African-American numbers have dipped, as well as areas in which baseball is trying to improve. I did this because I thought visuals would make the socio-economics that act against integration more concrete.

Many of the design problems I encountered came from the website’s interface. While I was able to graph the 75/856 African-American player representation, I was unable to present more information in that style graph because Piktochart informed me I did not have access too it. This resulted in my having to try to scratch-graph it, which explains why some of the baseballs in the second graph in that block are a bit wonky. I think Piktochart would benefit from some sort of “auto-align” tool for different columns/grouped information.

During revisions, aspects of my presentation (icons or what have you) would sometimes disappear for several sessions, which was unnerving. I would replace it in the infographic, and then the original would reappear sometimes days later. I also feel that Piktochart is a bit over-eager to group things together. Adding/changing text formats was annoying-it would revert to false in whatever font/color/size you wanted to change too, instead of simply changing existing fonts. As a first time Piktochart user, I felt the walk-through tutorial could be a little more robust and in-depth.

I feel that an infographic was a good approach to showing rather than telling, to acknowledge opposite arguments and refute them.

Reflection 2

I wanted my infographic to be beautiful evidence. So in constructing my presentation, I knew that there were definite Tuftean principles I wanted to apply. Firstly, due to spatial considerations, I, like Tufte, would need to become a proponent of visual density. The infographic is a very finite space, and given my topic one that I needed to make the most of.  It was at times difficult to strike a balance. It was in finding a balance that I began to experiment with font styles and size in order to maximize my real estate.

To avoid overpopulating my infographic, I relied partially on using the layout of the theme to separate and compartmentalize ideas. Tufte recommends keeping related information at eye level,  so readers understand that the information is connected (Tufte p.91). By quasi-cartouching, I hoped to avoid presenting a confusing and difficult to read column of text and image. So, I hope to have made it easier to differentiate between ideas in my infographic without having made my presentation choppy.

Font use was another way I attempted to distinguish between information types.I limited myself to 5 fonts, 4 font sizes, and 3 colors during my presentation. I wanted to use group information by font, so that when readers saw a font that had been previously used in my presentation, they would automatically make a link between the two pieces of information. I also but a lot of thinking into font selection, as Ellen Lupton, author of Thinking With Type, writes that there is a whole history and metaphor/ emotive aspect to font selection. Going off of this, I picked very clear, thin, almost severe “hard” fonts for factual information, and a wider, more spacious, “softer” font for quotes. I was my intention to use these alternative fonts to mimic the idea of “hard facts.” Courier New has a sense of coldness (I think, due to the thinness of the characters), so I used that font when talking about the real world and it’s inequality. Likewise, I chose a font for the quotes that counterbalanced this, reasoning that the quotes are from people trying to put their own spin on the situation, and thus are a bit inflated.

I think producing an infographic is a great working example of a selection from Tufte’s book ” whatever evidence it takes to understand what is going on” (Tufte p. 78). Piktochart offers a lot of images and icons, which could easily be converted into the type of distracting “phluff” as Tufte calls it, that litters many PowerPoint presentations. The challenge is to use these images as a mode of information, or as repetitive information. In my infographic, I use visuals (baseballs for timeline, a schoolhouse, etc) to reinforce the topic. This can be used to particular affect in graphing.Instead of using a pie or bar graph, which provide abstract visuals, I chose to display my data in a more visually appealing way. Instead of impersonal lines and circles, my graphs recall humanity. Further, the use of color and countable icons in my graphs is superior to visually abstract pie/bar charts when trying to project disparity.

I tried to show forward progress (where it existed) and used comparison whenever possible. Tufte argues for comparison when presenting data, as it provides context to information. So, for everything I touched upon, I tried to provide a scale. Without such knowledge, we can’t really ascertain if there is a problem. Scale comparison was especially important to my presentation, as it is about a group being marginalized. Instead of just saying there is a problem in baseball now, we must look at this years number as it relates to the whole history of African-Americans in baseball. We must look at contributing factors, and compare the African-American baseball population to African-American total population. Only through examining these factors can we accurately declare that there is a real problem with the number of African-American players represented.

I relied heavily on Tufte and Lupton’s theories in designing my infographic. Without their influences, I feel that my presentation would have been “pretty” (if I was lucky) without really having anything to say, which is a damnable sin in evidential presentations. Being able to go to their works for reference helped me understand way of putting content first, then using other aspects of the presentation as enhancements.

By using Lupton’s approach to layout, I feel that my attempt at a Tuftean infographic was as successful as a first-timer could be.

Categories: #IAMondays, baseball, class activities, diagrams, evidence, infographic, information architecture, tufte | Leave a comment

Publication Infographic Final

Infographic 3

Reflection 1:

My inspiration for this infographic was based on my recent research into the field of publication. I’ve found that there is a lot of confusing information out there, and most people I’ve spoken to don’t seem to understand all of the same ideas. For example, I have some writer friends on Twitter who are very excited about self-publication, but who don’t really know how it works or how much money they can expect to make. I thought it might be useful for them to have something that showed the important information all in one place.

Since the questions many writers face with publication usually involve decisions between one path or another, I decided a comparison of the various types of publication would be the most useful. From the beginning I planned to have a variety of three-way comparisons that would clearly lay out some of the major differences. This way people can see clearly what their options are, and make easy visual judgments about what is the most common, popular, or useful to them. A lot of the information I found normally didn’t make the comparisons as clear; the numbers were usually spread out in separate paragraphs without any direct explanation to link one number to another. This created some confusion, such as the articles I read making it hard to tell when they were referring to overall publication statistics, print books, or ebooks. Some of the numbers were left out of those articles entirely, and I had to extrapolate them (for example, the 6% of books being independently published weren’t mentioned at all, and I had to figure out that number after subtracting the self and traditional publication numbers).

One of the biggest limitations I found was that piktochart didn’t seem to have any good options for helping me align the various icons and background shapes I used. I had to eyeball a lot of things, and I feel like under close examination there will be visual flaws in the layout. I would have preferred if the program had a tool similar to Prezi’s that showed me when two objects were the same size, centered correctly, or aligned on the same horizontal or vertical point as each other.

I also felt I generally lacked enough artistic skill to make the layout visually appealing. I had to judge color choices and shapes simply by what I thought looked good. If I were to make an infographic in a professional environment, I would probably want to work together with someone with more artistic skills, collaborating on the design but letting the other person make the graphical choices while I did the writing. Either that, or practice enough myself to attain a higher level of skill than what I had here.

Reflection 2:

I laid out the text of the infographic with two types of hierarchy in mind. One was a change in color, which Lupton suggests can be uses for emphasis (p. 132) instead of italic or bold font. I decided that the headings for each grid would stand out well in color, compared to the plain white font I used for most of the text. Since I was laying out the text in a nonlinear fashion, I thought this emphasis would be a good way to draw the reader’s attention to each heading first. If I had been writing a normal paper where everything was linear and the reader followed the text from the top to the bottom, headings could have simply been placed between paragraphs, possibly in a larger font size. The layout of the infographic, however, meant that sometimes the headings were either above, below, or to the side of the information they related to. I felt this meant they needed to stand out in some way.

A second hierarchical method I used was simply changing the font size. The headings for each grid are in the largest size, the sub-headings (such as for self, indie, and traditional publication) are in a smaller size, and the main blocks of informative text are in the smallest. I wanted to avoid excessively fancy font choices, since they would have been unnecessary and distracting. Likewise, I avoided adding too much fancy imagery in the text frames, and stuck with simple colored blocks as backgrounds. I felt that either fancy font or excessive imagery would be what Tufte calls “chartjunk” (p. 152). Even some of the basic icons picktochart provides seemed like they would be content-free distractions and pointless decoration, which Tufte disapproves of. I therefore kept my use of icons to a minimum.

I tried to use a consistent color scheme throughout the infographic, in order to avoid distraction and unnecessary decoration. Even though I was already using simple colored blocks, I felt that too much color would make the infographic harder to read and ruin the continuity of design. Even when choosing my initial template, I avoided ones that seemed too “busy.” Pointless color and cartoonish design would have gone against Tufte’s suggestions that a design should be clear and efficient (p. 79).

I also attempted to make visual comparisons easy to see as a supplement to the numerical information being shown. Tufte suggested that information always needs to be compared with something specific and appropriate (p. 127). He also discusses how a good graphic should visually show the ratio between different statistics, with text included right alongside the graphics. Piktochart didn’t really allow me to make precise measurements, so I settled for rough size differences in the backgrounds on the ebook publication comparisons, with the 87,000 total ebooks in the largest box, and the 12,000 that were independently published in the smallest box. I then supplemented this with icons that give a quick visual comparison (1 book icon = 10000 sales).

The sections of the infographic were laid out to keep related information close to each other. I wanted to make sure that when the reader looks at the infographic, they can easily tell which information is related and should be considered together. Tufte suggests keeping relevant material within the common visual field (p. 91) in order to keep them unified. I kept this in mind when laying out each grid, so that all the information on print books is together in one place, ebooks in another place, distribution of money in another, and so on. Also, even though most of the grids have a three-way comparison between different pieces of information, I made sure to use a slightly different design on each. The first is triangles, the second rectangles, the third parallelograms, etc. This keeps each grid self-contained as its own block of information, with the intent of guiding the reader to view each grid as if it were a separate “page.”

All together my approach was to use simple design, with the goal of keeping the infographic plain while remaining visually appealing. The focus was on the content, not on artistic design for the sake of artistic design.

References:

Lupton, E. (2010). Type (2nd Expanded ed.). New York, NY: Princeton Architectural Press.

Tufte, E. (2006). Beautiful evidence (3rd ed.). Cheshire, CT: Author.

Categories: infographic | Tags: , , , | Leave a comment

An Infographic on the Importantance of Breakfast!

infographicfinalforreal


Reflection 1

I originally started out wanting to create an infographic on waffles, but I ran into a dilemma: what is there really to say about waffles? This is when I realized that there is so much to be said about breakfast. In this infographic, I wanted to build awareness that breakfast is essential for a healthy life and I also wanted to try and encourage those who don’t eat breakfast, to eat breakfast.  Furthermore, towards the end, I wanted to stress that it’s not just eating breakfast that is important, but what you eat for breakfast.

I start my infographic out with a timeline, which I feel slowly invites people in, especially when they see the “Eggo shortage” point.  After I get my audience’s attention, I share the statistics of the percentage of people who skip breakfast by age groups. These statistics are then followed by what percentages of those skippers are obese. I believe that these statistics alone will shock and draw attention to the changes that need to be made.  Towards the end, I have “building blocks” about nutrition, followed by lists of ways to create, and help any individual stick to a healthy breakfast.  I think these all flow together to help support my goals in educating the world about a healthy breakfast.

I think if I had to write a paper on this topic instead, it wouldn’t be as inviting or as easy to understand. I wanted to show statistics, but not in a way that was boring or repetitive.  However, this assignment did pose some challenges and issues. First, Piktochart separated everything into blocks which allowed for a lot of issues to occur when attempting to move things around. Second, it offered a limited amount of icons that didn’t really apply to my topic. For instance, after we spent a whole class deciding that a coffee cup would suffice for my chart, I had come home and I did not have the coffee cup available any more on my screen (for reasons unknown).  In my other chart, I had different color circles represent the amount of favorite breakfast foods, yet Piktochart made the key displayed as boxes. While I was able to cover these boxes with my own circles, this was a lot of unnecessary work that could’ve been avoided if Piktochart created a better presentation.

In the end, I think this might’ve been easier if I was a designer with some experience on how to put things together in a way that creates a good flow. However, as an experienced writer, I think I was able to create a good piece of writing. A piece of writing is about good content and the presentation of it, not just one or the other.

Reflection 2

Before I even started putting things on my infographic, I realized that Piktochart was already separated into blocks, which made it easy for me to think about it in terms of grids. As Lupton writes, grids “break space or time into regular units,” (p. 151).   On each block, I tried to figure out how I could create grids. For example, the title and explanation (at the top of my infographic) is broken into two grids, while the one that follows (the timeline) is displayed in one grid. I tried to alternate grids to create a better flow, but it also depended on the type of information I planned on displaying.

The information I used in my infographic varies on how it needed to be displayed. The timeline is a great example; it needed to be displayed in a whole block to show the distance of time from year to year. Furthermore, it was shown across the page, because according to Tufte “reading across describes sequence of movements,” showing the movement of time from left to right (p. 33).  I originally had my timeline going downwards, showing movement from an older year to a newer year, but I decided to change it as it didn’t match our metaphor of time. As humans, we often view time as across the horizon, moving towards one year and away from the other.

In the next grid, I display two statistics, which were crafted around both Tufte and Lupton’s theories on information design. Lupton writes that “design and text gently collaborate to enhance understanding,” (p. 7).  I put the percentage in a circle and had it displayed larger than the text it collaborated with in hopes that it would draw more attention to itself, and I believe this technique worked. The number and the text are not directly together; instead the text lies parallel to the number, but in a way that is not directly connected. As Tufte argued, most graphics that have nouns are connected by arrows or links, because “the evidence in variation in connections is stronger than evidence for sameness,” (p. 79). From this, I was able to pick out an arrow/link to connect the two together that provided a strong connection without distracting my audience. When I first came to these two statistics, I wasn’t sure how to display them. Originally, I had just thought that by writing it out as “22% are obese”, it would come off as boring and ineffective. I had remembered how I once read statistics in a magazine that was similar to the way I presented it, and then I recalled the theories presented by Lupton and Tufte, which were right on point. Tufte claims that there should be “no distinction among words and images” (p. 49), and I think by using arrows and links, there is no distinction between the two, at least in this case.

Next to this grid, I show more statistics; the percentage of people who skip breakfast, varying from male and female and from age group. This was originally displayed in a bar graph, which was what Tufte defined as chart junk. It was chart junk because it took information and made it into a bunch of junk that really had no effect on my audience. As Tufte argued, mapped pictures should “combine representational images with scales, diagrams, overlays, numbers, words, and images,” (p. 13).  In this grid, I attempted to do just that. I used the icon of a plate and utensils to display a certain percentage of people. This is what Tufte refers to as a sparkline, or a “data intense, design simple, and word sized graphic,” (p. 47). By displaying this information in this way, instead of the original bar graph way, it provides a greater level of understanding.

Understanding is the main goal of any piece of writing, so it’s important to involve metaphors in the way information is presented, as that’s how humans relate to things. In the next section, I used a squiggly boarder to make the grid appear as a chalkboard. Inside of the “chalkboard” I put blocks, and labeled them as “the building blocks of breakfast”.  I thought that this was a dead giveaway to the metaphor of building up your life to a great one. Furthermore, I really wanted to incorporate movement arrows in among these blocks, to show the relationships of the blocks. Tufte argues that “important comparisons among images should be pointed out by arrows, labels, and other methods of directing attention,” (p. 45). I added the circular arrows and other arrows to draw attention to the importance of each, but also to show the relationship among them.

In regards to relationships among the design, the text relationship to the design further enhances understanding. Although I was limited to the types of fonts available, I made sure each font correlated to the words. As Lupton writes, the goal is “to find an appropriate match between style of letters and the specific social situation and body of content that define the project at hand,” (p. 32). In other words, I viewed each portion of text as a human. Lupton claims that “words originated as gestures of the body” (p. 13) and that they give “language a physical body” (p. 13). I selected certain fonts depending on how they appeared, much like how we judge humans on how they appear. Furthermore, Lupton argues that the contrast between big and small type “creates drama and surprise,” (p. 45), so I attempted to use this technique to my advantage at certain points in my infographic. Overall, I think it’s safe to say that without Lupton and Tufte’s information design techniques, I may not have created a beautiful infographic that enhanced understanding on healthy breakfasts.

Resources:

Lupton, E. (2010). Type (2nd Expanded ed.). New York, NY: Princeton Architectural Press.

Tufte, E. (2006). Beautiful evidence (3rd ed.). Cheshire, CT: Author.

Categories: #IAMondays, class activities, diagrams, evidence, images, infographic, information architecture, mapping, pictorial images, technology, tufte | Tags: , , , , , , , , | Leave a comment

Home-schooling infographic

infographic    Here is my infographic rough draft on home-schooling. It is far from complete. I am still researching for relevant and interesting information, and Piktochart infuriates me to no end. I look forward to viewing all of yours, which will undoubtedly be better than mine.

Categories: infographic | Tags: | Leave a comment

A Pet Adoption Infographic: Rough Draft

Below is my rough draft for my infographic on pet adoption. Right now I already know of a few things I need to change–I will not be using the same two photos of the cat and dog (just need to find more CC licensed images), and the last space is a bit too cluttered. All feedback is appreciated!!


infographicroughdraft

Categories: infographic | Tags: , , , , , , , , , , , | Leave a comment

Blog at WordPress.com.