information architecture

Perspectives On Ergodic Literature Within The Field Of Writing

As I wrote in my prior reflection about the creation of Topaz Galaxies, generative poetry is a completely different form of composition and experience than that of traditional, print-based literature—even nonlinear, print-based literature at that. Ergodic literature is distinctive in both its composition process and the reading, or interaction with it. Espen Aarseth, author of Cybertext: Perspectives on Ergodic Literature defines ‘cybertext’ as, “the wide range of (or perspective) of possible textualities seen as a typology of machines, as various kinds of literary communication systems where the functional differences among the mechanical parts play a defining role in determining the aesthetic process” (p. 13).

This said, when approaching eLit, or cybertext, or ergodic literature, we must first recognize our expectations and biases that are subconsciously carried over from prior experience with print-based literature. For example, one expectation could be that the narrative must “make sense” in terms of its use, placement, or arrangement of channels of language (i.e., words, phrases, numbers, punctuation, etc.) Typically, we  approach a piece of writing thinking we are supposed to ‘get something out of it’, and the ‘thing’ we are supposed to get out of it  has been (mostly) pre-determined and pre-designed for us. (Just think of novels, newspaper articles and poetry. Most, on some level, operate within the framework of information transmission; and in line with this structural dynamic, the human act of  ‘reading’ is simply the exchange we make to get the message that the text contains.

Now, the metaphor for ergodic literature is more like what occurs in a dream-state: we are constructing meaning as we interact within the dream and simultaneously we are also constructing the dream itself. Using generative poetry for example, the meaning is created by the complex process of interacting with the text on multiple levels. Aarseth writes, “There is a short circuit between the signifier and the signified, a suspension of difference that projects an objective level beyond the text, a primary metaphysical structure that generates both textual sign and our understanding of it, rather than the other way around” (p. 3).  Looking closer at the transmission/translation process, which occurs inside the mind of the user and stems from the combination of physical, sensory experience and the technical nature of the medium: “During the cybertextual process, the user will have effectuated a semiotic sequence, and this selective movement is a work of physical construction that the various concepts of “reading” do not account for. This phenomenon I call ergodic using a term appropriated from physics that derives from the Greek words ergon and hodos, meaning “work” and “path” (p. 2-3). And, it is from this perspective that Aarseth introduces the concept of “nontrivial effort” (p. 2) on the part of the reader, which is decidedly different than what a person engages in when they read a book or a magazine—and, I would argue, even literature that is consumed in a digital space but constructed in a structure lent from a static, print-based ideas.

Now, examining the production and consumption of texts, and thus of literature, within the context of digital spaces, we must ask the question: can ergodic compositions and other forms of cybertext truly be considered literature?

If we examine the outworkings of culture, we see the creation and evolution of phenomena like the genre, for example.  Just as art imitates life, genres are birthed as offspring of a particular era, and they reflect the experience and values of the people. My point being: we can’t simply dismiss forms of expression because they don’t neatly fit within the construct of canonized works. When we relegate forms of composition to a place illegitimacy, it is often because we have approached them with misplaced expectations that (usually unintentionally) carry over from previous interactions, whose mental paradigms are rooted in constructs that are alien to the work at hand. But alas, culture evolves. And so do ways of communicating and interacting.

Franco Moretti, in his book Graphs, Maps, Trees, (2005) discusses abstract models for literary history; he argues, (quoting Mentre), “The aesthetic sphere [and thus, I would argue, the arts] is perhaps the most appropriate to reflect overall changes of mental climate” (p. 21). Further, regarding cultural evolution, Moretti argues that a ”generation style” depends entirely on “the trigger action of the social and cultural process” (p. 21).  Nelson, in Computer lib/Dream machines argues that the computer is a “projective system” and writes, “The things people try to do with movies, TV, and the more glamorous uses of the computer, whereby it makes pictures on the screens—are strange foldovers of the rest of the mind and heart. That’s the peculiar origami of the self” (p. 305).  In our emergent culture, we can conclude that technology, and thus electronic literature (eLit), are manifestations of society. Therefore, when we examine digital works, it should be with the intent of discovering changes in our social topographic landscape. As Aarseth argues, “If these texts redefine literature by expanding our notion of it . . . then they must also redefine what is literary, and therefore they cannot be measured by an old, unmodified aesthetics” (p. 13).

In sum, these new kinds of literature are already literature simply because they are external manifestations of a present cultural current; and that current is active and alive, evolving and growing—whether we want to acknowledge it as being legitimate or not in the canonized sense. If we can appreciate electronic literature by placing ourselves within its ecology, we can then perhaps begin to awaken our faculties to expressions that were already present within us, but were never given voice to because the external apparatus (conduit) wasn’t yet realized.  But now, we have a whole new playing field.

Sources

Aarseth, E. (1997). Introduction: Ergodic literature. In Cybertext: Perspectives on Ergodic Literature. Baltimore, MD: Johns Hopkins University Press. Retrieved from http://cv.uoc.edu/~04_999_01_u07/aarseth1.html. [pdf]

Moretti, F. (2007). Graphs, Maps, Trees. London, New York: Verso.

Nelson (1974, 1981). Computer lib / Dream machines. In N. Wardrip-Fruin (Ed), The new media reader (pp. 303 – 338). Cambridge, MA: The MIT Press. [pdf]

Categories: elit, ergodic literature, information architecture | Tags: , , , , , , , , , | Leave a comment

Informed Infographics: Using Theory to Support Visual Presentations

“Hurricane Sandy: The Financial Aftermath” infographic presents financial data, statistics, and a personal account in one space, and it examines the financial plight of storm victims in light of the financial assistance they have received through FEMA and insurance policies, compared to the financial loss suffered.

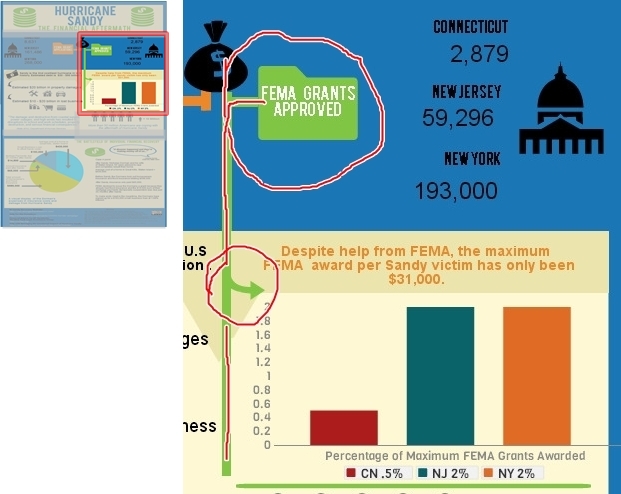
To set up a comparative framework, (as seen in the screenshot below) I contrasted the number of FEMA grant applications sent in from Connecticut, New Jersey, and New York, with the number of FEMA grants that were actually approved for those states respectively. For example, in the upper third of my infographic, I used icons to help convey different kinds of information:  the folder icon for bureaucratic process, the money bag icon for funds, and an icon that resembles our capitol building to represent state government.  Edward Tufte, (2006) contemporary author and expert on the visual display of qualitative and quantitative information, writes in Beautiful Evidence, to place labels directly on images when possible–which in turn helps to reinforce and concretize connections and causal relationships. “For showing evidence, the map metaphor suggests that labels belong on images, that external grids help scale images, and that data are more credible when contextualized” (p. 21). Likewise, I have placed the labels for “FEMA Grant Applications” and “FEMA Grants Approved” directly onto the orange and green folder icons. The names of the states and the numerical data are placed in very close proximity so that they appear as sets of information, easily distinguishable from one another.

Hurricane Sandy: The Financial Aftermath

Tufte instructs, “For explanatory presentations, important comparisons among images should usually be pointed out to viewers by means of annotations, arrows, highlighting, or other methods of directing attention” (p. 45). Therefore, to concretize connections on the page-space, I use different styles of arrows. For example, in the mid-section, the green arrow that flows off of the green line functions to connect the upper portion featuring the data about “FEMA Grants Approved” to the graph which states the exact dollar amount of the Maximum FEMA Grant ($31,000) and the percentage of people in Connecticut, New Jersey, and New York who received the Maximum FEMA Grant Award.

Hurricane Sandy: The Financial Aftermath

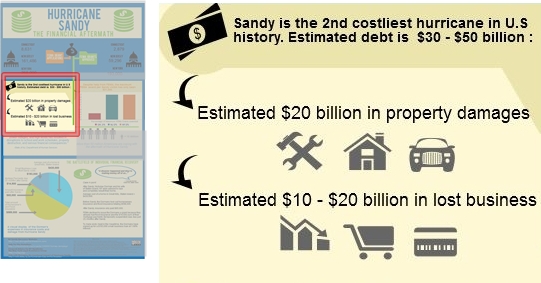
Moving over to the left-hand side of the mid-section, (see screenshot below) I use curved black arrows to connect the first statistic about Hurricane Sandy being the 2nd costliest hurricane in U.S. history to more specific financial data. First, I state that the estimated debt from the storm as being $30 – $50 billion and then just below that statistic I provide a breakdown, ($20 billion in property damages and an estimated $10 – $20 billion in lost business). The arrows are black because the icons are gray; so having a difference in color between the elements helps to break up the visual field and differentiates the arrows from the images.  Here, the arrows not only serve to visually connect the information, but they also create a sense of hierarchy by functioning as bullet points.

Hurricane Sandy: The Financial Aftermath

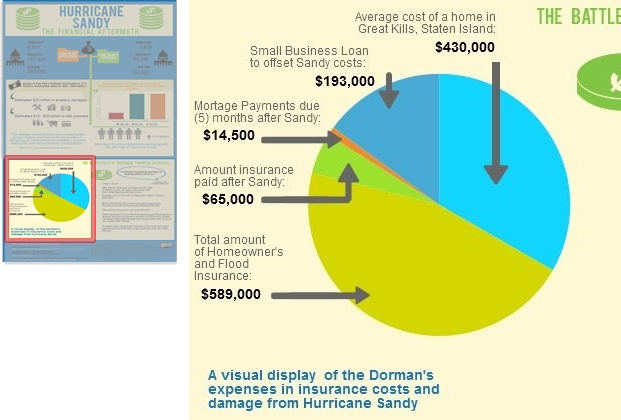
Now, when creating the pie chart to represent the financial aftermath of the storm on an individual level, I had the option to simply connect the financial data to the chart using thin lines in a minimalist style. However, Tufte would argue that, “The more generic the arrows and lines, the greater the ambiguity” (p. 68). So, in line with his ideas, I decided to create customized arrows to help ground the text and numbers to the exact place on the pie chart. Doing so helps to avoid confusion and assists the reader in being able to quickly scan the infographic and see what information is being communicated without having to closely study and dissect the graphic.

Hurricane Sandy: The Financial Aftermath

Ellen Lupton, (2010) author of Thinking With Type, writes, “A typographic hierarchy expresses the organization of content, emphasizing some elements and subordinating others” (p. 132). To create a sense of hierarchy for the bottom third of the infographic, I used the same font for the header, “The Battlefield of Individual Financial Recovery” that I used for the main title, “Hurricane Sandy, The Financial Aftermath”. I made this design choice in order to convey that the information presented is not a continuation of the mid-section, but instead a new set of information. Additionally, I added visual distinction by shading it in green. Just below the header, outlined in a blue speech bubble, is a direct quote from Nicholas Dorman, a Great Kills, Staten Island resident, which serves as a caption: “A disaster happened and they’re making money off of us.” I wanted to use a direct quote from a real person to allow the statistics and financial information a more human feel, which in turn helps the reader to better identify with the case presented.

Some readers are “primarily attracted to pictures and captions, while others prefer to follow a dominant written narrative…” (Lupton, 2010, p. 130). The caption assists in framing the range of financial facts and data in a more local scope and personal context, and it also lets the reader know at a glance specifically what the text is going to discuss. Regarding typographic design choices for pie chart label, I selected a vivid blue in a Helvetica typeface at a size 14 font, bold. These attributes allow the chart label to be easily read while appearing visually soft at the same time, so as not to be appear too heavy or overpowering.  As Lupton writes, “Scale is the size of the design elements in comparison to other elements in a layout as well as to the physical context of the work” (p. 42).

Hurricane Sandy: The Financial Aftermath

Sources

Lupton, E. (2010). Thinking with Type. New York: Princeton Architectural Press.

Tufte, E. (2006). Beautiful Evidence (3rd Edition). Cheshire: Graphics Press LLC.

Categories: infographic, information architecture, technology, tufte | Tags: , , , , , , , , , | Leave a comment

Hurricane Sandy, The Financial Aftermath: An Infographic

I have been researching Hurricane Sandy since it occurred in October of 2012 and have since created a multimodal project that presents the emotional and material aftermath of experience. However, in recent months (currently about 8 months after Sandy), storm victims are still facing extremely difficult financial realities—for many people trying to navigate the gauntlet of insurance policies and FEMA procedures has proven to be an overwhelming task, to such an extent that it has required bringing in legal help from out-of-state skilled in dealing with flood disasters. For example, many storm victims are grappling with the reality that, (unbeknownst to them) if they had insurance prior to the storm, they may be ineligible to receive money from FEMA—or very little at that. And in other cases, insurance companies are denying payment until borrowers can show proof of how the money will be spent. Recovering from the devastation of losing your home, your vehicle, nearly all of your material possessions is hard enough, let alone be denied compensation after having paid thousands in flood and homeowner’s insurance. After hearing about people having to take out loans well into the six-figure range just to float costs while trying to recover, I wanted to bring attention to the crushing circumstances Hurricane Sandy victims are still facing. My infographic highlights the hard-hitting financial reality of the storm on both a broad scale and an individual level.

My infographic, "Hurricane Sandy: The Financial Aftermath" using Piktochart technology

My infographic, “Hurricane Sandy: The Financial Aftermath” using Piktochart technology

For example, in the upper third of my infographic, to represent FEMA and grant money (grant applications and grants approved) I used an icon which resembles a government building. I placed this icon on the left and right sides. Additionally, through the affordance of color and the use of shapes to highlight and connect information, I selected green for “FEMA Grants Approved” and used green lines to further connect the folder icon in the upper third, (“Grants Approved”) to the statistics and chart in middle third, (right side) where I used a chart to highlight facts about the maximum amount of FEMA awards and the percentage of maximum ($31,000) award for New Jersey, New York, and Connecticut. Doing so assists the reader in understanding a more specific reality pertaining to storm victims trying to get help from the government after the devastation–even though thousands did receive help, the amount of help the received is like a drop in the bucket compared to the funds that are actually needed to make a difference.

In conclusion, upon analyzing my process, I was somewhat pleased with the infographic results overall, in light of the fact that this was my first time using Piktochart. However, in retrospect, I think I would have liked to have more expertise in creating charts and visual displays of data. Specifically, I would like to have been able to present the reader with a type of chart that focuses on a comparative relationship. For example, I was able to plug in the figures for the Dorman’s financial facts, (e.g., average cost of home in Great Kills, amount of their small business loan to offset debt and setbacks from the storm, the amount their insurance paid versus the amount their insurance was supposed to cover, etc.,) but I would have liked to somehow compare the funds received as relative to what they were covered for, and the average price of a house in Great Kills, (as their home was destroyed in the storm). Being able to have more control over the visual representations of data in this way would better assist me in portraying the devastating amount of financial loss that many people are currently dealing with. However, I look forward to using Piktochart more in the future and employing this mode of representation which allows my reader to make visual connections with ease and quickly understand complex information.

Categories: infographic, information architecture | Tags: , , , , , , , , , | Leave a comment

Generative Poem Reflection 2

There are two threads that are repeated in our readings of digital composition: the belief that producers must offer over some control over the creation of meaning of a text to their audience, and we should be arranging ideas/information differently-focusing on associative rather than linear connections.

So, how do these ideas fit in with poetry and electronic literature? Word choice is one way. As I mentioned in my other reflection, given the generative poem’s code structures-think poetry formatting rules like iambic pentameter or haiku and you’ve got it-writers aren’t really sure when and where any given word will appear. They can estimate where in the poem a word will appear by looking at where they add it into the code, but beyond that, it’s random. What does this mean? That word choice cannot be as “random” as it appears. The thought that electronic literature is simply a lot of randomly generated text is a fairly disparaging idea that is bandied about too much. The words in generative poems are not randomly selected, rather like traditional print poems they are governed by form.

Further dispelling the myth of random selection-as in all poetry, the words that appear in a generative poem are selected because they are deemed effective and connected to the topic by the writer. So it goes with generative poems. However, this must be taken a step further. Words in generative poetry must be especially effective, since as stated above we remain unsure when and where they will appear. That means the poet must carefully select words that will impact and further the idea/topic of the poem. The poet cannot have any weak words, each must be able to be associated to the poem. Takei, George provides a fine example. Lines about warp factors, rapiers,  internment camps, action figures, and homosexuality seem odd, to say the least. Until you as a reader begin to think in an associative way, looking for connections. Then we can see that the lines are telling us about Mr. Takei’s life-from a childhood in an internment camp during WW2, to popularity as Star Trek’s rapier-wielding Mr. Sulu to becoming a leading figure in the gay community.

Associative thinking also encourages the handing over of the control and creation of meaning. We as writers must recognize that meaning is ultimately decided by the reader, what they put into a piece, what they attach to words. Generative poetry naturally extends this. Go back to Takei, George. It does not start with the same line it did when you first went there. This is a conscious decision made by the producer of the poem/poem’s code. It is designed to remove the idea that there is only ONE spot to start reading, and only ONE spot to end, which means that you can be reading a poem the wrong way. Random line generation, as well appearance and disappearance of lines, removes the idea that there is only one way to read the poem. This hopefully focuses the reader on absorbing the words, rather than focusing on the style-since they generate fairly rapidly, the reader must pay them all of the attention. The style also forces the poet into favoring short phrases and individual words, so they can never be quite sure how a line will end up looking. for readers, this means the poet cannot lead the reader to a conclusion, as is the case in print.

It is strange that generative poetry not be considered as serious a literary style as print genre. Such poems certainly fit the definition of poetry. Even if readers (wrongly) approach generative poetry with opinions based off of traditional literature, it cannot be denied that generative poetry is as evocative as its print counterpart, and that the two share more stylistic heritages than might be suspected. If creators and consumers can begin to approach generative poetry and elit on their own terms, than there is no reason that the body of literature cannot make room for these genres.

Categories: elit, ergodic literature, generative poem, information architecture, technology, Uncategorized | Leave a comment

Transform, Girl: A generative poem and reflections

Transform,Girl, my generative poem, was a fun and unique writing experience! Check it out, and then read my reflections below!!

1.

My generative poem was largely about the idea of naming and the way that names we use to identify people change during different phases of our lives. Specifically, my poem focuses on “nice” names and “mean” names. The names I chose were all names I have been called throughout my life, both good and bad. In some cases, not all the “mean” names are really mean, but in the context of the poem, and in the context they were used, they were intended to hurt. For example, names like “nerd, geek, and lesbian,” are all in the mean names section, even though there is no real problem self-identifying as though names. I wanted my poem to show the impact that naming can have on people throughout their lifetimes, so I chose names that were related to childhood as well as adulthood, like “Sweet pea” and “Lover,” respectively. Some of the names are more like titles, but they still function as an identifier. I picked verbs that would create a sense of tension between the two names, so that the above (nice) names would be split by either a happy or sad verb. The effect was interesting. The nice names would be split by a sad verb and the transformation would be completed by the mean name. For example, “Dearest becomes choke it back you PSYCHO.,” shows the transformation from “Dearest” to “Psycho.” The verb that splits the nouns is forceful and aggressive. The lines that break the transformative sentences often come out sounding hopeful, for example “My Love escape”,and when sandwiched between two transformative sentences the effect is jarring. Alternatively, when a mean name is next to a nice verb, like “LOSER rejoice,” the effect is more harsh. I like the way it came out, alternating between pain and happiness constantly. I wrote the mean names in all caps to make it feel as though someone was yelling while you were reading, and I like the way it separates the mean words from the rest of the poem and makes them jump out from the page. The indented lines show hope and longing, and are combined with varying adjectives that either sound happy or sad. These breaks are intended to show that no matter how much others may try to break you down, there will still be some shred of hope, even if it is convoluted (by odd adjectives.) I also picked very bright, obnoxious colors to make the poem hard to ignore.

I really enjoyed crafting a poem this way. I think it made me have to think of things from new perspectives, because the poem would always generate differently and be seen by different people at different times with different experiences and perspectives. Because of the nature of the generative poem, I had to write it so that it would be accessible to everyone and make sense (for the most part) no matter how it generated. I also had to pay attention to the way the code looked and the structure of how it was written, for example, all of the above words are nice names, all the below words are mean names, etc. I knew some people would be looking at the code to see how it was structured, so I needed to keep it uniform for appropriate poem-telling and meaningful structure. Overall I loved having to think about poetry in a completely new way. I think it will make my future poetry more nuanced because I will be paying attention to more details!


2.

Cybertext may seem like it does not fall under the category of “literature” because it is not the first thing that comes to mind when we think of literature. Although cybertext may not be traditional literature, cybertext is not as different than we think. One of the many complaints about cybertext is its level of nonlinearity. Cybertext tends to be different in each reading, but so is any novel! We all bring different perspectives to literature every time we read. According to Epsen Aarseth’s experiences in his chapter on “Ergodic Literature,” many literary theorists say that “all literature is indeterminate, nonlinear, and different for every reading.” (2). Therefore, even traditional literature is indeterminate! Our interpretations may change for each reading, whether we are reading cybertext or a novel. Likewise, readers of cybertext are often more “in control” of their reading experiences. They are able to make choices and understand text differently because of their individual choices. Different readers may take away different meanings. But Aarseth again cites literary theorists who argue that readers of all literature, cyber or traditional, must make decisions to understand the text (2). This is perhaps why, in a classroom setting, students have more than one interpretation of the same novel. Both of these arguments Aarseth rebuts in his chapter, because he says many literary theorists who make these arguments are not well-versed in cybertext, but I think the theorists may be, in some ways, correct. Cybertext is ergodic literature, in the sense that Aarseth defines ergodic as “requiring work,” because it requires the reader, or user, to become a more active participant. But cybertext is still literature. Cybertext falls into another separate facet of the literature umbrella.

So what does the idea of cybertext as literature say about traditional literature? Well, it means that we need to think more critically about how we structure literature and how we view literature as whole. If literature is written in response to our society and what our society finds interesting/important/pertinent, then cybertext is an outpouring of our ever-changing society. Traditional literature is often a reflection of societal shifts (think Dickens and any of his novels written in response to the industrial revolution!), and, if cybertext is ergodic literature, and thus literature, what is cybertext written in response to? According to Lev Manovich in his piece “Cultural Software” software, or what allows us to create things like cybertext, permeates all areas of contemporary society (7). Therefore, the software that helps shape cybertext is necessitated by society. Think about it, our current society is based on fast-paced technologies, so we can’t expect things like literature to remain entirely stagnant and unchanging. In a society where we can build almost anything our minds can create, why wouldn’t we rethink ways to present literature? The software of cybertext directly influences its presentation and structure, so we build cybertext around the software created by society. HTML and JAVA code exists to run webpages, so authors have adapted this code structure to re-imagine poetry and storytelling. Similarly, our society demands customization and individuality, and cybertext offers Aarseth’s ergodic component of reader-driven experiences, making it work seamlessly with the desires of contemporary readers. In a way, cybertext has sprung up before many of us realized we wanted or needed it, much the way any new form of expression begins. Traditional literature may always remain popular, but cybertext meets many of the new desires of our rapidly changing society.

Cybertext may be met with skepticism at first, like any revolutionary invention, but soon I believe it will be considered functional and beautiful literature. Cybertext forces readers to stretch their minds and work for understanding. It keeps readers on their toes and allows for unique experiences. Cybertext can be revisited and may never become stale and expected. It seems cybertext is the quirky new friend, while traditional literature is the old, steady companion. Neither one if better than the other, and they are still friends–they just bring different things to the party!

Categories: ergodic literature, generative poem, information architecture | Tags: , , , , , , , | Leave a comment

Treaty of Greens: Generate this! (Reflections)

Treaty of Greens (generative poem)

Reflection 1

As a person who isn’t that into traditional poetry, I was less than enthused with an assignment that was labeled as “generative poetry.” In traditional poetry, I typically pick a specific subject or mood and run with that, so I did the same approach with this assignment. At the beginning of this assignment, I was in the process of writing a theorized letter to my CEO (at Walgreens), where I argued the lack of love for cashiers. I was feeling pretty passionate about my job, so that’s how I stumbled upon Walgreens as my subject matter. I planned on creating a poem that showed the virtues and triumphs of cashiers, until I had a terrible day at work. My goal evolved into showing the “dark side” of Walgreens.

The word choice part was pretty easy, at least in comparison to traditional poetry. I decided to have one group of words that portrayed more to my job title, and another category of words that portrayed to the customer. I decided to capitalize words that would show anger or aggression, or other words that could relate to such a subject. For example, I capitalized ASSHOLES because that’s typically something cashiers scream in their head at rude customers. In a different light, I capitalized PATIENCE because it’s something most customers seem to lack. I think by capitalizing certain words this emphasizes certain points in the poem, which seems to add a nice touch. Furthermore, this creates contrast. The verbs were a little bit more difficult to come up with, for some reason I cannot explain. I think part of it is because I was trying too hard to think of unique verbs. I felt that most of the verbs I managed to scrounge up were rather boring and didn’t paint a picture, but I wanted the verbs to relate to Walgreens. I did manage to get a few odd verbs in there as “engulf”, “defecates”, and “delegate”. These are still loosely tied to the job of a cashier, especially at my store, and I think it really puts a twist on the generative poem.

As mentioned previously, I wasn’t crazy about traditional poetry before this, so I wasn’t too excited for this assignment. While I didn’t love this assignment, I did enjoy that I could essentially have a computer create a poem for me, only each time it would magnificently different than the previous time. This poem definitely challenged me to rethink how poetry is composed in general. By creating poetry in this way, through code, it really changed what poetry can be. It helped me see that poetry, whether through code or traditional, follows some type of pattern with words. However, the generative poetry really expands poetry. Instead of having a traditional sentence, that most people would write, generative poetry can create these crazy, enlightening sentences that one would never think of creating. It’s this aspect that has challenged me to really rethink poetry; maybe I didn’t like traditional poetry because of all of the constraints and limitations. This generative poem has helped me see that anything can be poetry; I don’t need to conform to certain poetry idealism’s in order to create a great poem. Furthermore, this assignment has helped me to start to consider that code itself is poetry; it follows a certain pattern, adheres to certain rules, and creates meaning in something.

Reflection 2:

There are many people in society today who don’t believe that this very assignment on generative poetry is not a true form of literature; we could even argue that there is one of those nonbelievers among our graduate course (cough Jason cough). It’s understandable for most readers to first assume that generative poetry is unlike traditional poetry and literature in general, but after studying it and learning the essence behind codes, it can be argued that there really is no difference at all.

In Perspectives on Ergodic Literature Espen Aarseth (1997) argues that cyber text focuses on the “mechanical organization of the text, by posting the intricacies of the medium as an integral part of the literary exchange,” (p. 1). In simpler terms, the computer is not just the medium, it’s part of the text too.  Aarseth further argues that cyber text is no different from other texts because all literature is different for every reader, the reader has to make choices in order to make sense of the text, and a text can only be read in one sequence at a time (p. 2) All three of these standards apply to both the generative poem assignment, as well as traditional poetry or literature in general.

Generative poetry and electronic literature challenges traditional text, but that doesn’t mean that the newly invented literatures don’t qualify as literature. Aarseth writes that “text is something more than just marks upon a surface,” (p. 12), meaning that text is something that creates meaning and allows for the flow and exchange of ideas. In The Semantic Web Revisited, Nigel Shadbolt, Wendy Hall, and Tim Berners-Lee (2006) claim that the Web consists of “documents for humans to read to one that included data and information for computers to manipulate,” (p. 96).  Even if computers are manipulating the text, much like in the generative poem, meaning is still being made by the reader, or even, humans. And then, the same argument occurs: there is a difference between paper and computer texts. But what is the difference? Aarseth argues that “the real difference between paper texts and computer texts is not very clear,” (p. 10) and it is true; other than the medium, what is the difference?  There are obvious subtle differences, like computers run on electric and the words are coded to appear on a screen, but the argument is that this code is literature too. How? Code uses a certain language and follows a pattern in order to create something meaningful to the reader. Codes can change the color of a text or background, among millions of other things. In comparison, the human hand and mind can write poetry with a certain rhythm that displays different emotions. The medium is still literature.

Since we can consider generative poetry as a type of literature with the evidence presented, we must consider what this means for the composition and structure. Aarseth writes that cyber text “centers attention on the consumer, or the user, of the text,” (p. 1), which changes the way that we compose. Instead of composing a poem for a traditional reader, we must begin to consider other options. For example, readers can be users or even co-authors. We must write in such a way that can account for that; the text must be more interactive to allow for the co-authorship. However, this poses a bit of a threat for the “reader”. Aarseth argues that the cyber text reader “is not safe” which means we can argue that “they are not a reader,” (p. 3). Most books are predictable and allow for full control, but with these newly developed ways of writing, more risks are available for the reader. The reader can fail at understanding how to navigate through the text which leads to a lack of understanding.

Understanding then, is linked to interpretation. But not interpretation as we know it. In “What does it mean to ‘interpret’ code,” a blogger writes that interpretation is no longer what it used to be; it’s not that “search for what the author secretly meant,” but rather it is the exploration of “semiotic objects in order to explore culture and systems of meaning.” This definition changes how we view literature; it’s not about that problem or climax, it’s about the meaning behind the text, and the interaction the text has with the medium to create that meaning. Just as words work together on a page to create a narrative, or within a Haiku to show imagery and emotion, words work behind the screens of a screen with code and the computer to create meaning.

Resources:

Aarseth, E. (1997). Introduction: Ergodic literature. In Cybertext: Perspectives on Ergodic            Literature. Baltimore, MD: Johns Hopkins University Press. Retrieved from            http://cv.uoc.edu/~04_999_01_u07/aarseth1.html.

Berners-Lee, T., Hall, W., Shadbolt, N., (2006). The semantic web revisited.

What does it mean to ‘interpret’ code? (n.d.) Critical Cod Studies.

Categories: Alphabetic Text Analysis, class activities, elit, ergodic literature, evidence, generative poem, images, information architecture, mapping, semantic web, technology | Tags: , , , , , , , , , | Leave a comment

Linear or Non: Which is Better?

One of our readings last week was Afternoon: A Story, by Michael Joyce. While this was in some ways a very unusual and innovative story, I don’t know if I could say it had any advantages over a more traditional storytelling method.

In a traditional story, it’s generally expected that the reader will follow a linear path, page by page, from beginning to end. This might seem limited by modern standards in the digital age, but I think there are many advantages to it. In a traditional linear story, the tale is being told in a coherent, straightforward way. There is a beginning, a sequence of events, and an ending; the same ending every time. This means that the reader, if they ever read the story again, knows what to expect. It also means that two people can both read the story and discuss it, knowing they’ve both read the same story.

“Afternoon,” on the other hand, is different every time you read it. I’ve read sections of it four separate times now, and each time I’ve had a different experience. There doesn’t seem to be anything predictable about it.

Does this nonlinearity make it better, or worse?

I can see some entertainment advantages to a nonlinear story. When I was a kid, I frequently enjoyed Choose Your Own Adventure stories, which allowed you to take the same story down a different path each time you read it. A reader is more likely to re-read such a story, knowing they can enjoy a different experience each time. Other similar nonlinear media includes certain video games, and DVDs where the movie has multiple endings.

These nonlinear stories have just as much disadvantage, however. Sometimes, a reader might WANT to experience the same story again. The more complex the divergent paths in a story become, the less likely it is that the reader can ever experience the same story again.

This would become even more pronounced in a code poem that utilized a randomizer. In that case, odds are the reader will NEVER experience the same story again.

I think one of the big differences here is the difference between storytelling and entertainment. Both qualify as “art,” but one is vastly different from the other. I don’t think “Afternoon” qualifies as a “story” in the way one is traditionally defined. It doesn’t have a clear plot or ending. While it is still entertaining, and still artistic, it doesn’t have the same effect on the reader. Is it even possible to say what it is “about”? I have a hard time, after multiple divergent readings, really understanding what was going on in the story. Many of the individual “pages” seemed so disconnected from each other that it was hard to follow what was happening from one to the next. It seems like this is the price to pay for a more “artistic” piece; it becomes more unusual and unique, but at the same time harder to really understand.

In a way I’d compare that to the ideas of abstract art. A piece of art with no defined form can be interpreted differently by each person who views it. A more defined piece of art, however, simply is what is is (setting aside deeper analysis of symbolism and metaphor within a work).

I don’t know if it’s fair to say either a linear or nonlinear story is “better” or “worse.” However, it definitely has disadvantages that make it more complex and harder to understand.

Categories: information architecture | Tags: , , , , , , , | 5 Comments

#iamondays How to Write E-Lit

On Twitter, Devon posted this:

blogpost4a

Which is a link that leads us to this:blogpost4

The “Fun da mentals” of e-lit. A very old image to teach us how to do something new. When I first saw this picture, I was immediately reminded of Robinson and his book The Story of Writing, and for some reason, the fossils reminded me of the section about “rebuses”. And with good reason, I think. These fossils are rebuses, and they relate to e-lit because most often, e-lit uses pictorial images. It’s crazy to think that we are still using techniques from the middle ages. But then again, everything we know has developed from something in the past. For example, the computer, and it’s many components (such as the internet, hypertext, and cyber text).

Hypertext is e-lit. But first, let’s look at the actual structure of this page that Devon posted. In my own opinion, it’s quite simplistic and bare. In fact, it even seems to resemble a piece of paper, which still shows that we’re relating how we write today to how we once used to write. However, the website seems to do a nice job of incorporating grids, as we learned about from Lupton. If we just browse at the first page, there is a cornucopia of blue. Blue, of course, is hypertext.  As Nelson wrote, hypertext means “forms of writing which branch or perform on request,”; in other words, any of the blue links that we see daily.

But how do these links happen? How can you possible think of making all of the connections? There are ways, tutorials, and even webpages that will do it for you, so it’s really not a question of how. It’s actually, more of a why. But the why is in the purpose of this blog post: electronic literature.

Now then, first we must learn to understand electronic literature. It’s unlike traditional literature, it’s not bound by specific outcomes and there’s no specific beginning or ending. So how can we learn about it with the idea of traditional reading and writing lodged in our noggins? With practice and coherence, it can be done.

Fun da mentals actually offers some interactive ways to learn and become familiar with electronic literature, which is something that Nelson writes is a good thing. There is a “hornbook” which helps students begin to understand how to read electronic literature. The hornbook teaches about nodes and paths, but also provides exercises that allow the students to get involved. By clicking on the “reader” section we can learn how electronic literature let’s us explore it. This section is headlined by “This sentence is false” and then teaches how different nodes (clickable parts of a sentence) can develop different stories or ideas, much like in The Jews Daughter.

The most interesting part of Fun da Mentals is the “Coloring book” link. As the only way to learn how to color is by practicing, at some point you learn that you’re doing it right when you color inside the lines. Students learn about creating electronic literature by doing similar exercises to that of a coloring book. It involves navigation by clicking.

Speaking of navigation by clicking, the Fun da Mentals is almost an example of  e-literature. Yes, it’s obvious that the page is full of hypertext, but what makes e-lit is that the reader is in control. He or she can click around and expand the story on their own. For instance, once I begin reading the description of “the coloring book” I see that the word “anatomy” is a link, in which I click it. It takes me to the anatomy interactive portal, which is not directly related to what I was just focusing on. In this same description, there is a clickable word that says “electronic tool”. I am compelled to find out what an electronic tool is, so I click on it. I read about electronic tools. However, here is where there’s an issue: Each page that I’ve clicked on, they’ve offered other links, but none of them seem to take me back to the original story line. Therefore, we could argue that this is not electronic literature.

Electronic literature can be complex, especially when we’ve grown up and only been exposed to one type of literature (traditional). It takes time and practice to learn a new trade. As Fun da Mentals is attempted to do, it’s important to constantly practice and enrich yourself into what you’re trying to learn in order to better adapt.

Categories: #IAMondays, Alphabetic Text Analysis, class activities, evidence, images, information architecture, mapping, pictorial images, semantic web, technology | Tags: , , , , , , , , , | 3 Comments

It’s time to transform with creative thinking

You’re currently reading words that are floating around on cyberspace. You’re not viewed as a reader, but as Aerseth writes, you are on your own adventure, taking risks. So, while we’re taking risks and exploring, Nelson mentions that most of us don’t actually understand the computer.  At first I thought that this meant we don’t understand how computers work, or even, how to operate computers and I expected to read something like a computer manual. Don’t get me wrong, Computer Lib / Dream Machine is certainly a manual of some type, but not the traditional manual.

Everything we’ve been reading and learning about recently has been quite the opposite of the traditional things we’re used to. I even though about writing this blog post in a different way, against the grain, but I had no idea where to even start; we must take baby steps. As Nelson argues, we learn most things by beginning with “vague impressions” (p. 303).  The first step in understanding the computer is to learn that it is a media that provokes emotions and helps us write, think, and show (Nelson, p. 306).

Now, the key word is help. It’s not the writer itself, nor it solely just the delivery method. For example, in Taroka Gorge (and the others too), a real human being came up with the basic structure: the main idea and the words. The computer put together the form and structure: how the words appeared to the audience. In the poems we read, there’s a feedback loop that keeps using the same words and creating different outcomes. I’m going to attempt to do so myself, but I have a hunch it’s much easier when a computer does it.

Roscoe retaliates to grab my banana whole heartedly.

My banana retaliates.

Roscoe grabs.

My whole banana.

My heartedly banana grabs Roscoe.

I think you get the point. Something that took me a few minutes to do would take a computer seconds to do. So in essence, it can be argued that computers essentially think for us, but not without the correct input.

But how do we learn what the correct input is? Well, as Nelson shows from the article,  “No more teachers’ dirty looks”, it’s beginning next to impossible to teach. Schools are focusing so much on standardized this and standardized that, that creativity is thrown out the window. Surely this is displayed in any type of creative situation, but especially in computers. How can the youth of the future learn how to be creative when computer classes are tailored to very specific tasks and are very standardized?  Furthermore, it can be said that the education system is behind in change. Literature teachers are teaching poems from a long history ago, yet they seem to glide over the current period of poems: e-lit at its finest.

Last week, we struggled, or at least I struggled, to understand the electronic literature we were required to read. We learned that it was difficult for us to tailor our traditional style of reading because it was all that we had known. If schools spend time teaching electronic literature, alongside traditional literature, students would become accustomed and be better able to code switch from one to the other.  As Nelson argues, “students should develop through practice, abilities to think,  argue, and disagree intelligently (p. 310).  But instead of this, students spend countless hours learning about topics that bore them to tears. One that I can recall, from both high school and community college, is the basic computer class that teaches you how to use Microsoft programs. Why is that a real class? And even more, it strictly taught and tailored the projects we would do. The whole class had to create an excel spread sheet from the same baseball statistics. How boring and inconclusive. And even more, these classes started the rave for PowerPoint, and we all know how Tufte feels about PowerPoint (which I think goes for all of us as well). I think it’s time the school systems caught up to the technology that is vastly developing.

The question about all of this, which Nelson asked as well ,is how will we use these creations? (p. 117). This is something that could truly be in our hands, yet it might also slip away if not treated carefully. School systems, and society, need to recognize these new ways of writing and creative thinking as a real possibility, and they need to begin to educate on them.  The time for transformation is now.

Categories: class activities, images, information architecture, mapping, semantic web, technology, Uncategorized | Tags: , , , , , | 4 Comments

My infographic reflections

info2

Reflection 1

As a huge baseball fan, I wanted to find an aspect of the sport I could make an interesting presentation on (instead of Hey, so-and-so can still throw X amount of curve balls after X amount of years). In researching baseball-not uninfluenced by the amount of “42” trailers-I decided to investigate diversity in baseball. This was further revised to African-Americans and their presence in baseball. I’ve had arguments about this before, and many people simply say something along the lines of “It doesn’t matter what color a person is, baseball is just about how good you are as a player.” While this is true, I wanted to be able to illustrate that there are roadblocks keeping African-Americans from developing into major-league talent.

One of the problems I encountered with my first draft was a lack of any sense of narrative. I was all over the place. In this draft, I was able to focus on one group, which really helped me show change over time and offer reasons for the change. Since my topic is essentially disparity, I wanted visual reminders. To this end, I used graphs and color options to emphasize the differences. I also made use of the icons/images offered by Piktochart when talking about the reasons offered/suggested for why the African-American numbers have dipped, as well as areas in which baseball is trying to improve. I did this because I thought visuals would make the socio-economics that act against integration more concrete.

Many of the design problems I encountered came from the website’s interface. While I was able to graph the 75/856 African-American player representation, I was unable to present more information in that style graph because Piktochart informed me I did not have access too it. This resulted in my having to try to scratch-graph it, which explains why some of the baseballs in the second graph in that block are a bit wonky. I think Piktochart would benefit from some sort of “auto-align” tool for different columns/grouped information.

During revisions, aspects of my presentation (icons or what have you) would sometimes disappear for several sessions, which was unnerving. I would replace it in the infographic, and then the original would reappear sometimes days later. I also feel that Piktochart is a bit over-eager to group things together. Adding/changing text formats was annoying-it would revert to false in whatever font/color/size you wanted to change too, instead of simply changing existing fonts. As a first time Piktochart user, I felt the walk-through tutorial could be a little more robust and in-depth.

I feel that an infographic was a good approach to showing rather than telling, to acknowledge opposite arguments and refute them.

Reflection 2

I wanted my infographic to be beautiful evidence. So in constructing my presentation, I knew that there were definite Tuftean principles I wanted to apply. Firstly, due to spatial considerations, I, like Tufte, would need to become a proponent of visual density. The infographic is a very finite space, and given my topic one that I needed to make the most of.  It was at times difficult to strike a balance. It was in finding a balance that I began to experiment with font styles and size in order to maximize my real estate.

To avoid overpopulating my infographic, I relied partially on using the layout of the theme to separate and compartmentalize ideas. Tufte recommends keeping related information at eye level,  so readers understand that the information is connected (Tufte p.91). By quasi-cartouching, I hoped to avoid presenting a confusing and difficult to read column of text and image. So, I hope to have made it easier to differentiate between ideas in my infographic without having made my presentation choppy.

Font use was another way I attempted to distinguish between information types.I limited myself to 5 fonts, 4 font sizes, and 3 colors during my presentation. I wanted to use group information by font, so that when readers saw a font that had been previously used in my presentation, they would automatically make a link between the two pieces of information. I also but a lot of thinking into font selection, as Ellen Lupton, author of Thinking With Type, writes that there is a whole history and metaphor/ emotive aspect to font selection. Going off of this, I picked very clear, thin, almost severe “hard” fonts for factual information, and a wider, more spacious, “softer” font for quotes. I was my intention to use these alternative fonts to mimic the idea of “hard facts.” Courier New has a sense of coldness (I think, due to the thinness of the characters), so I used that font when talking about the real world and it’s inequality. Likewise, I chose a font for the quotes that counterbalanced this, reasoning that the quotes are from people trying to put their own spin on the situation, and thus are a bit inflated.

I think producing an infographic is a great working example of a selection from Tufte’s book ” whatever evidence it takes to understand what is going on” (Tufte p. 78). Piktochart offers a lot of images and icons, which could easily be converted into the type of distracting “phluff” as Tufte calls it, that litters many PowerPoint presentations. The challenge is to use these images as a mode of information, or as repetitive information. In my infographic, I use visuals (baseballs for timeline, a schoolhouse, etc) to reinforce the topic. This can be used to particular affect in graphing.Instead of using a pie or bar graph, which provide abstract visuals, I chose to display my data in a more visually appealing way. Instead of impersonal lines and circles, my graphs recall humanity. Further, the use of color and countable icons in my graphs is superior to visually abstract pie/bar charts when trying to project disparity.

I tried to show forward progress (where it existed) and used comparison whenever possible. Tufte argues for comparison when presenting data, as it provides context to information. So, for everything I touched upon, I tried to provide a scale. Without such knowledge, we can’t really ascertain if there is a problem. Scale comparison was especially important to my presentation, as it is about a group being marginalized. Instead of just saying there is a problem in baseball now, we must look at this years number as it relates to the whole history of African-Americans in baseball. We must look at contributing factors, and compare the African-American baseball population to African-American total population. Only through examining these factors can we accurately declare that there is a real problem with the number of African-American players represented.

I relied heavily on Tufte and Lupton’s theories in designing my infographic. Without their influences, I feel that my presentation would have been “pretty” (if I was lucky) without really having anything to say, which is a damnable sin in evidential presentations. Being able to go to their works for reference helped me understand way of putting content first, then using other aspects of the presentation as enhancements.

By using Lupton’s approach to layout, I feel that my attempt at a Tuftean infographic was as successful as a first-timer could be.

Categories: #IAMondays, baseball, class activities, diagrams, evidence, infographic, information architecture, tufte | Leave a comment

Blog at WordPress.com.